- Hits: 3527
Penicillin Quantification for MEGBI-APP
1- Experiment 3: Penicillin quantification
In this section we have realised two trial the first is with an industruel penicillin to know the efficacity of the proposed protocole then the quantification is applied to our produced penicillin.
The first trial of quantification:
Step 1:
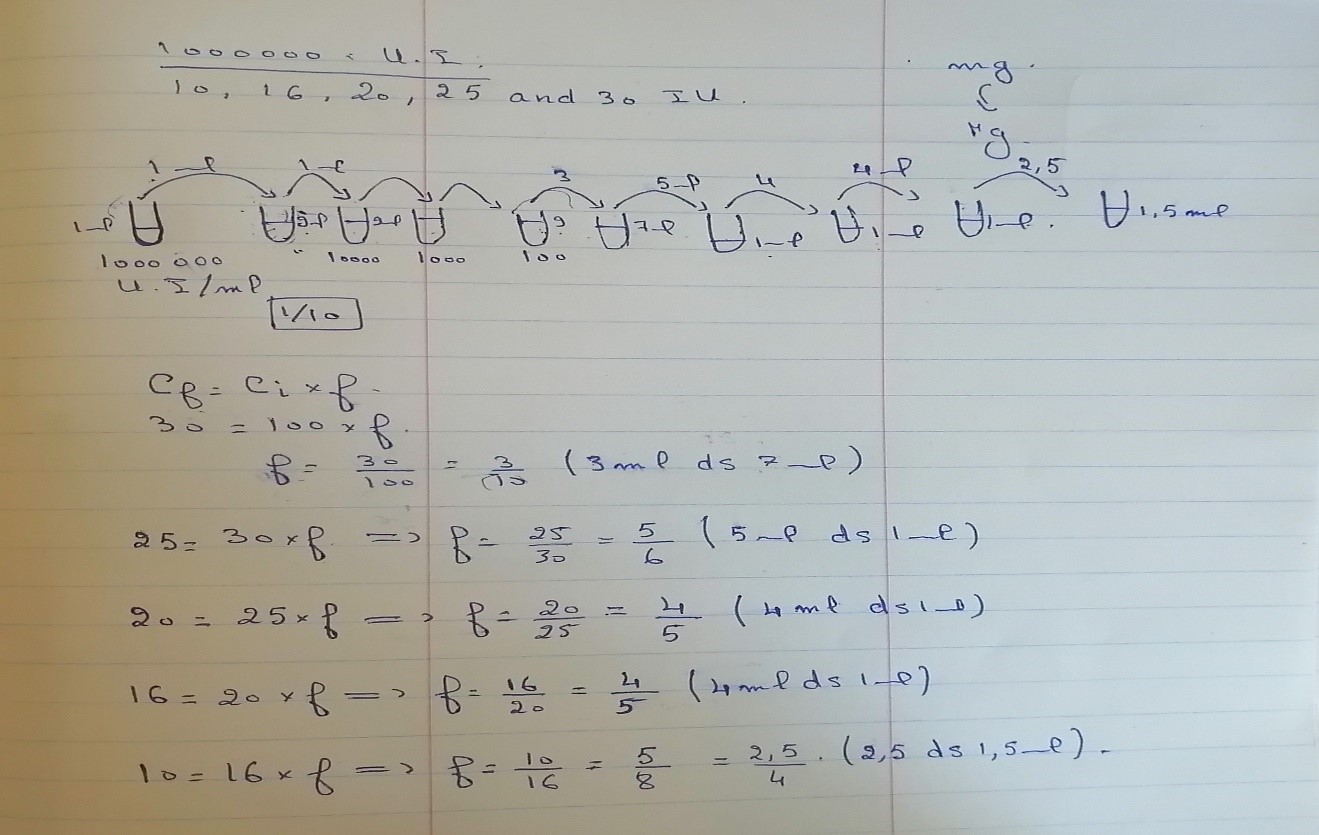
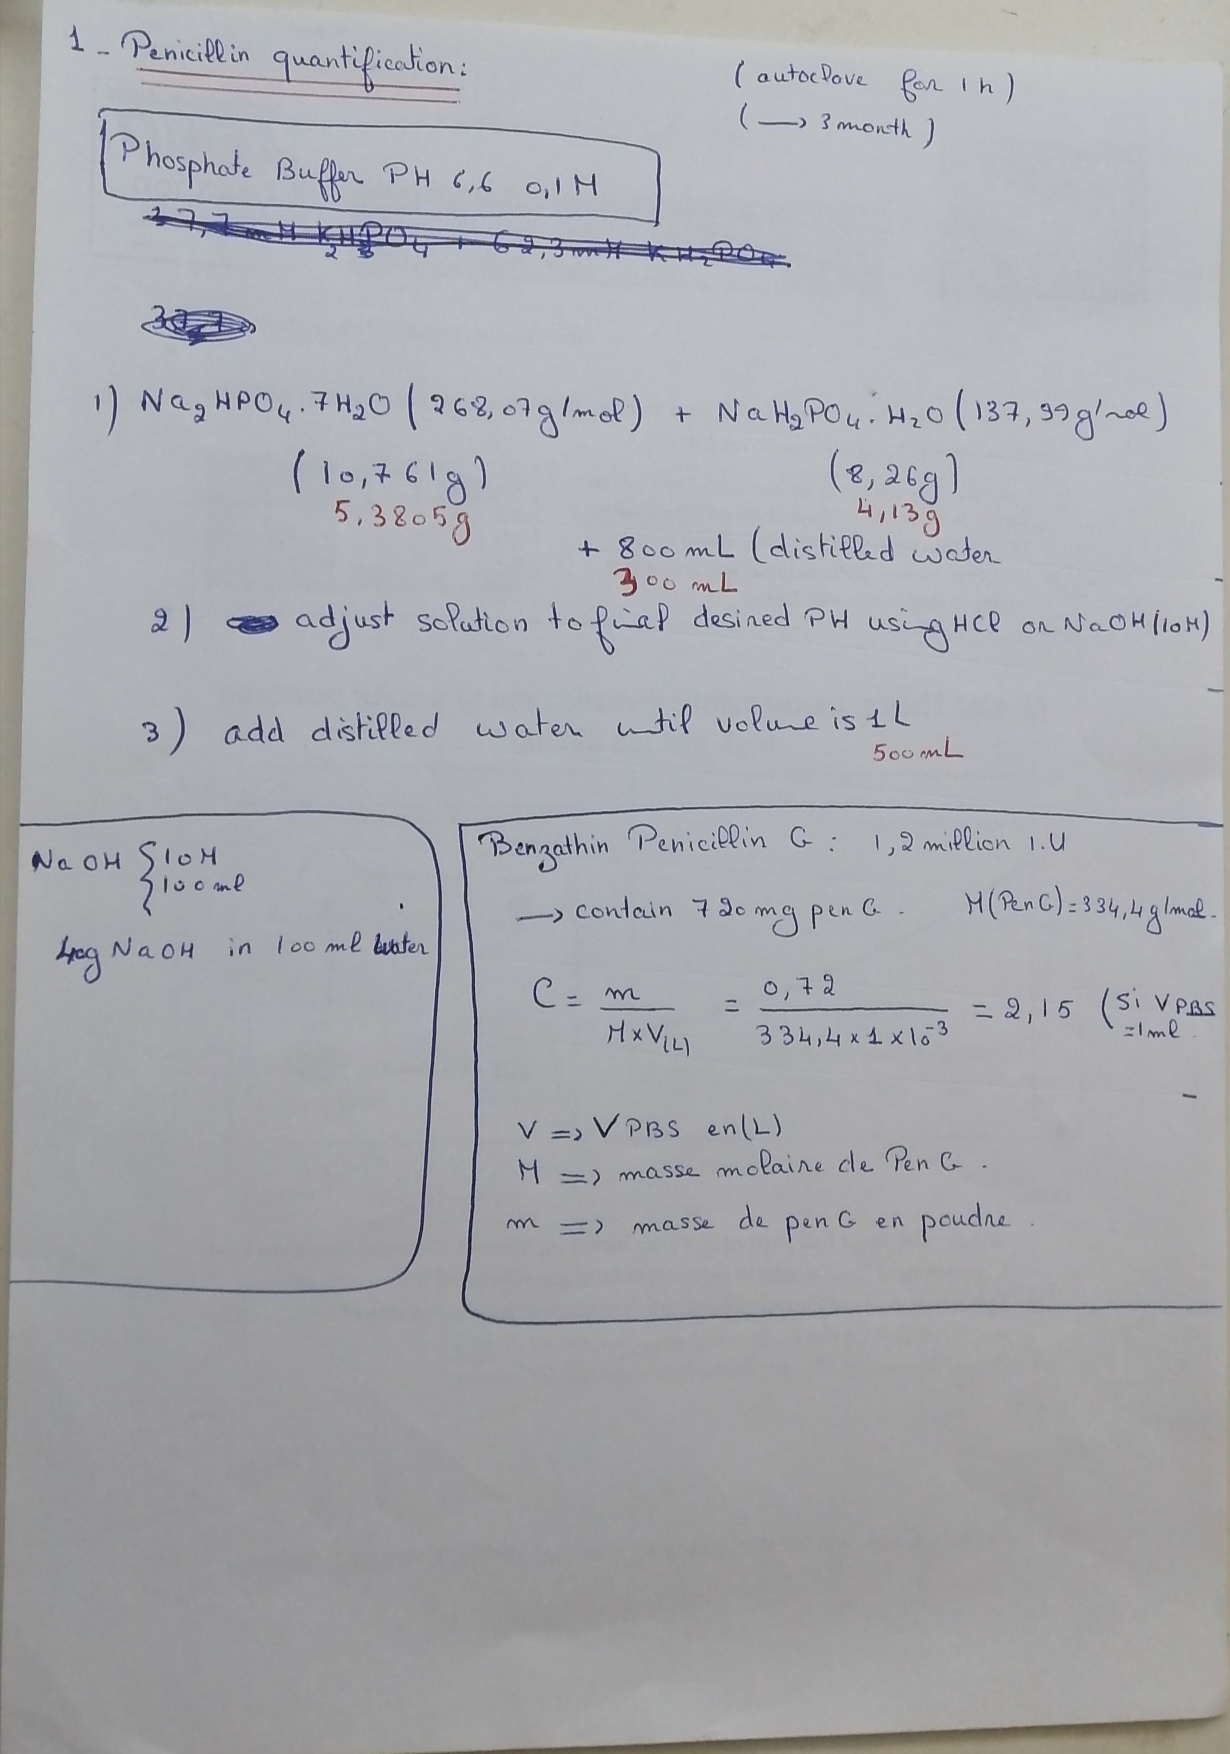
- First we dissolute the industruel penicillin (1000000 UI) in 1 ml phosphate buffer(1000000 UI= 600mg penicillin g sodium)
- We filtrate the obtained solution of penicillin to obtain a stock solution containing 1000000 UI/ml.
- From this stock solution we add 1 ml in 9 ml of physiological water (NaCl0.9%). Here the concentration is 100 000 UI/ml and the tube is called tube 2
- From the recent solution (tube 2) we add 1 ml in 9 ml of physiological water (NaCl0.9%). Here the concentration is 10 000 UI/ml and the tube is called tube 3.
- From the recent solution (tube 3) we add 1 ml in 9 ml of physiological water (NaCl0.9%). Here the concentration is 1 000 UI/ml and the tube is called tube 4.
- From the recent solution (tube 4) we add 1 ml in 9 ml of physiological water (NaCl0.9%). Here the concentration is 100 UI/ml and the tube is called tube 5.
- From the tube 5 we took 3 ml and we put them in 7 ml of physiological water (NaCl0.9%). Here the concentration is 30 UI/ml and the tube is called tube 6.
- From the tube 6 we took 5 ml and we put them in 1 ml of physiological water (NaCl0.9%). Here the concentration is 25 UI/ml and the tube is called tube 7.
- From the tube 7 we took 4 ml and we put them in 1 ml of physiological water (NaCl0.9%). Here the concentration is 20 UI/ml and the tube is called tube 8.
- From the tube 8 we took 4 ml and we put them in 1 ml of physiological water (NaCl0.9%). Here the concentration is 16 UI/ml and the tube is called tube 9.
- From the tube 9 we took 2.5 ml and we put them in 1.5 ml of physiological water (NaCl0.9%). Here the concentration is 16 UI/ml and the tube is called tube 9.
Here we have obtained the standard concentration that we will need for drawing the standard curve of concentration.
!!!! The think that the physiological water will be sterile(autoclaved) is important.
Step 2 :
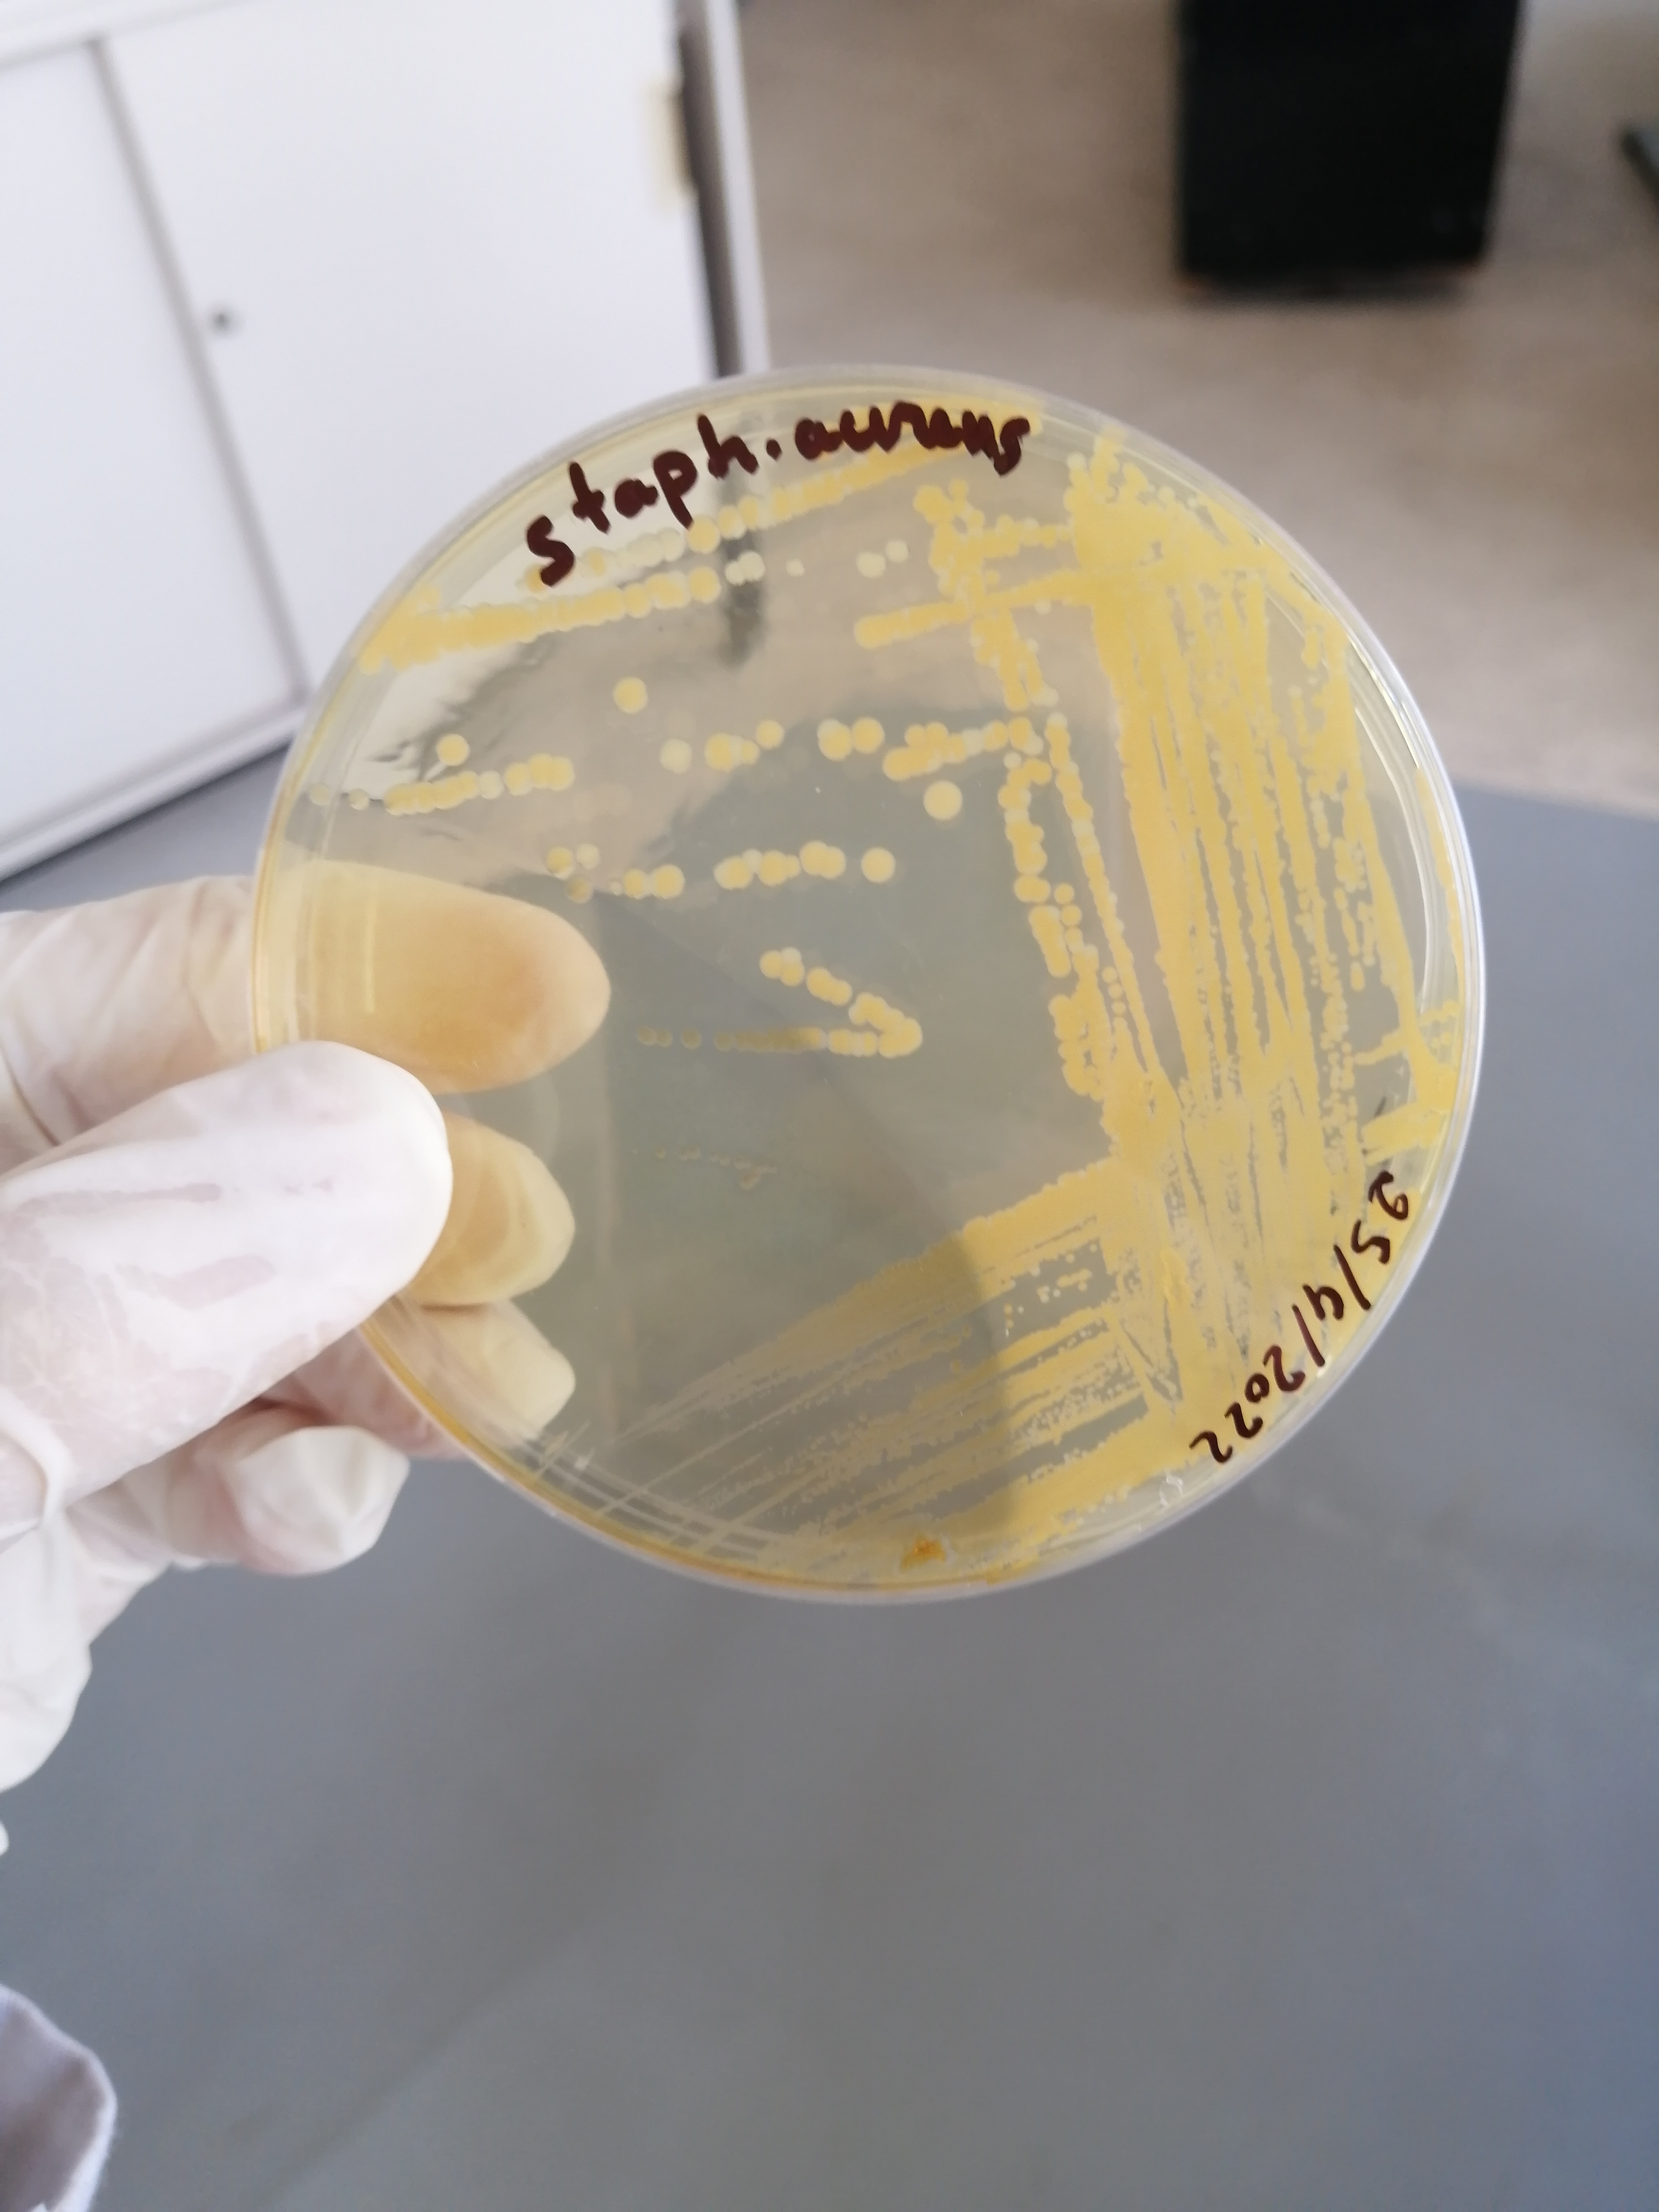
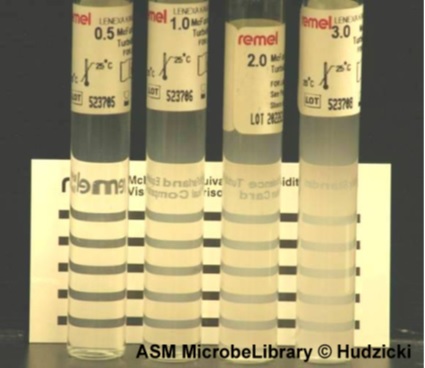
- First we prepared the bacterial inoculate (desired bacterial strain in sterile physiological water) to rich a bacterial concentration of 0.5 MF. In this step a standard 0.5 MF is used to know the bacterial concentration.
- Then we streaked them into a surface of Muller-Hinton agar by using a swab with a rotation of 60o each time to make sure that the entire medium is covered.
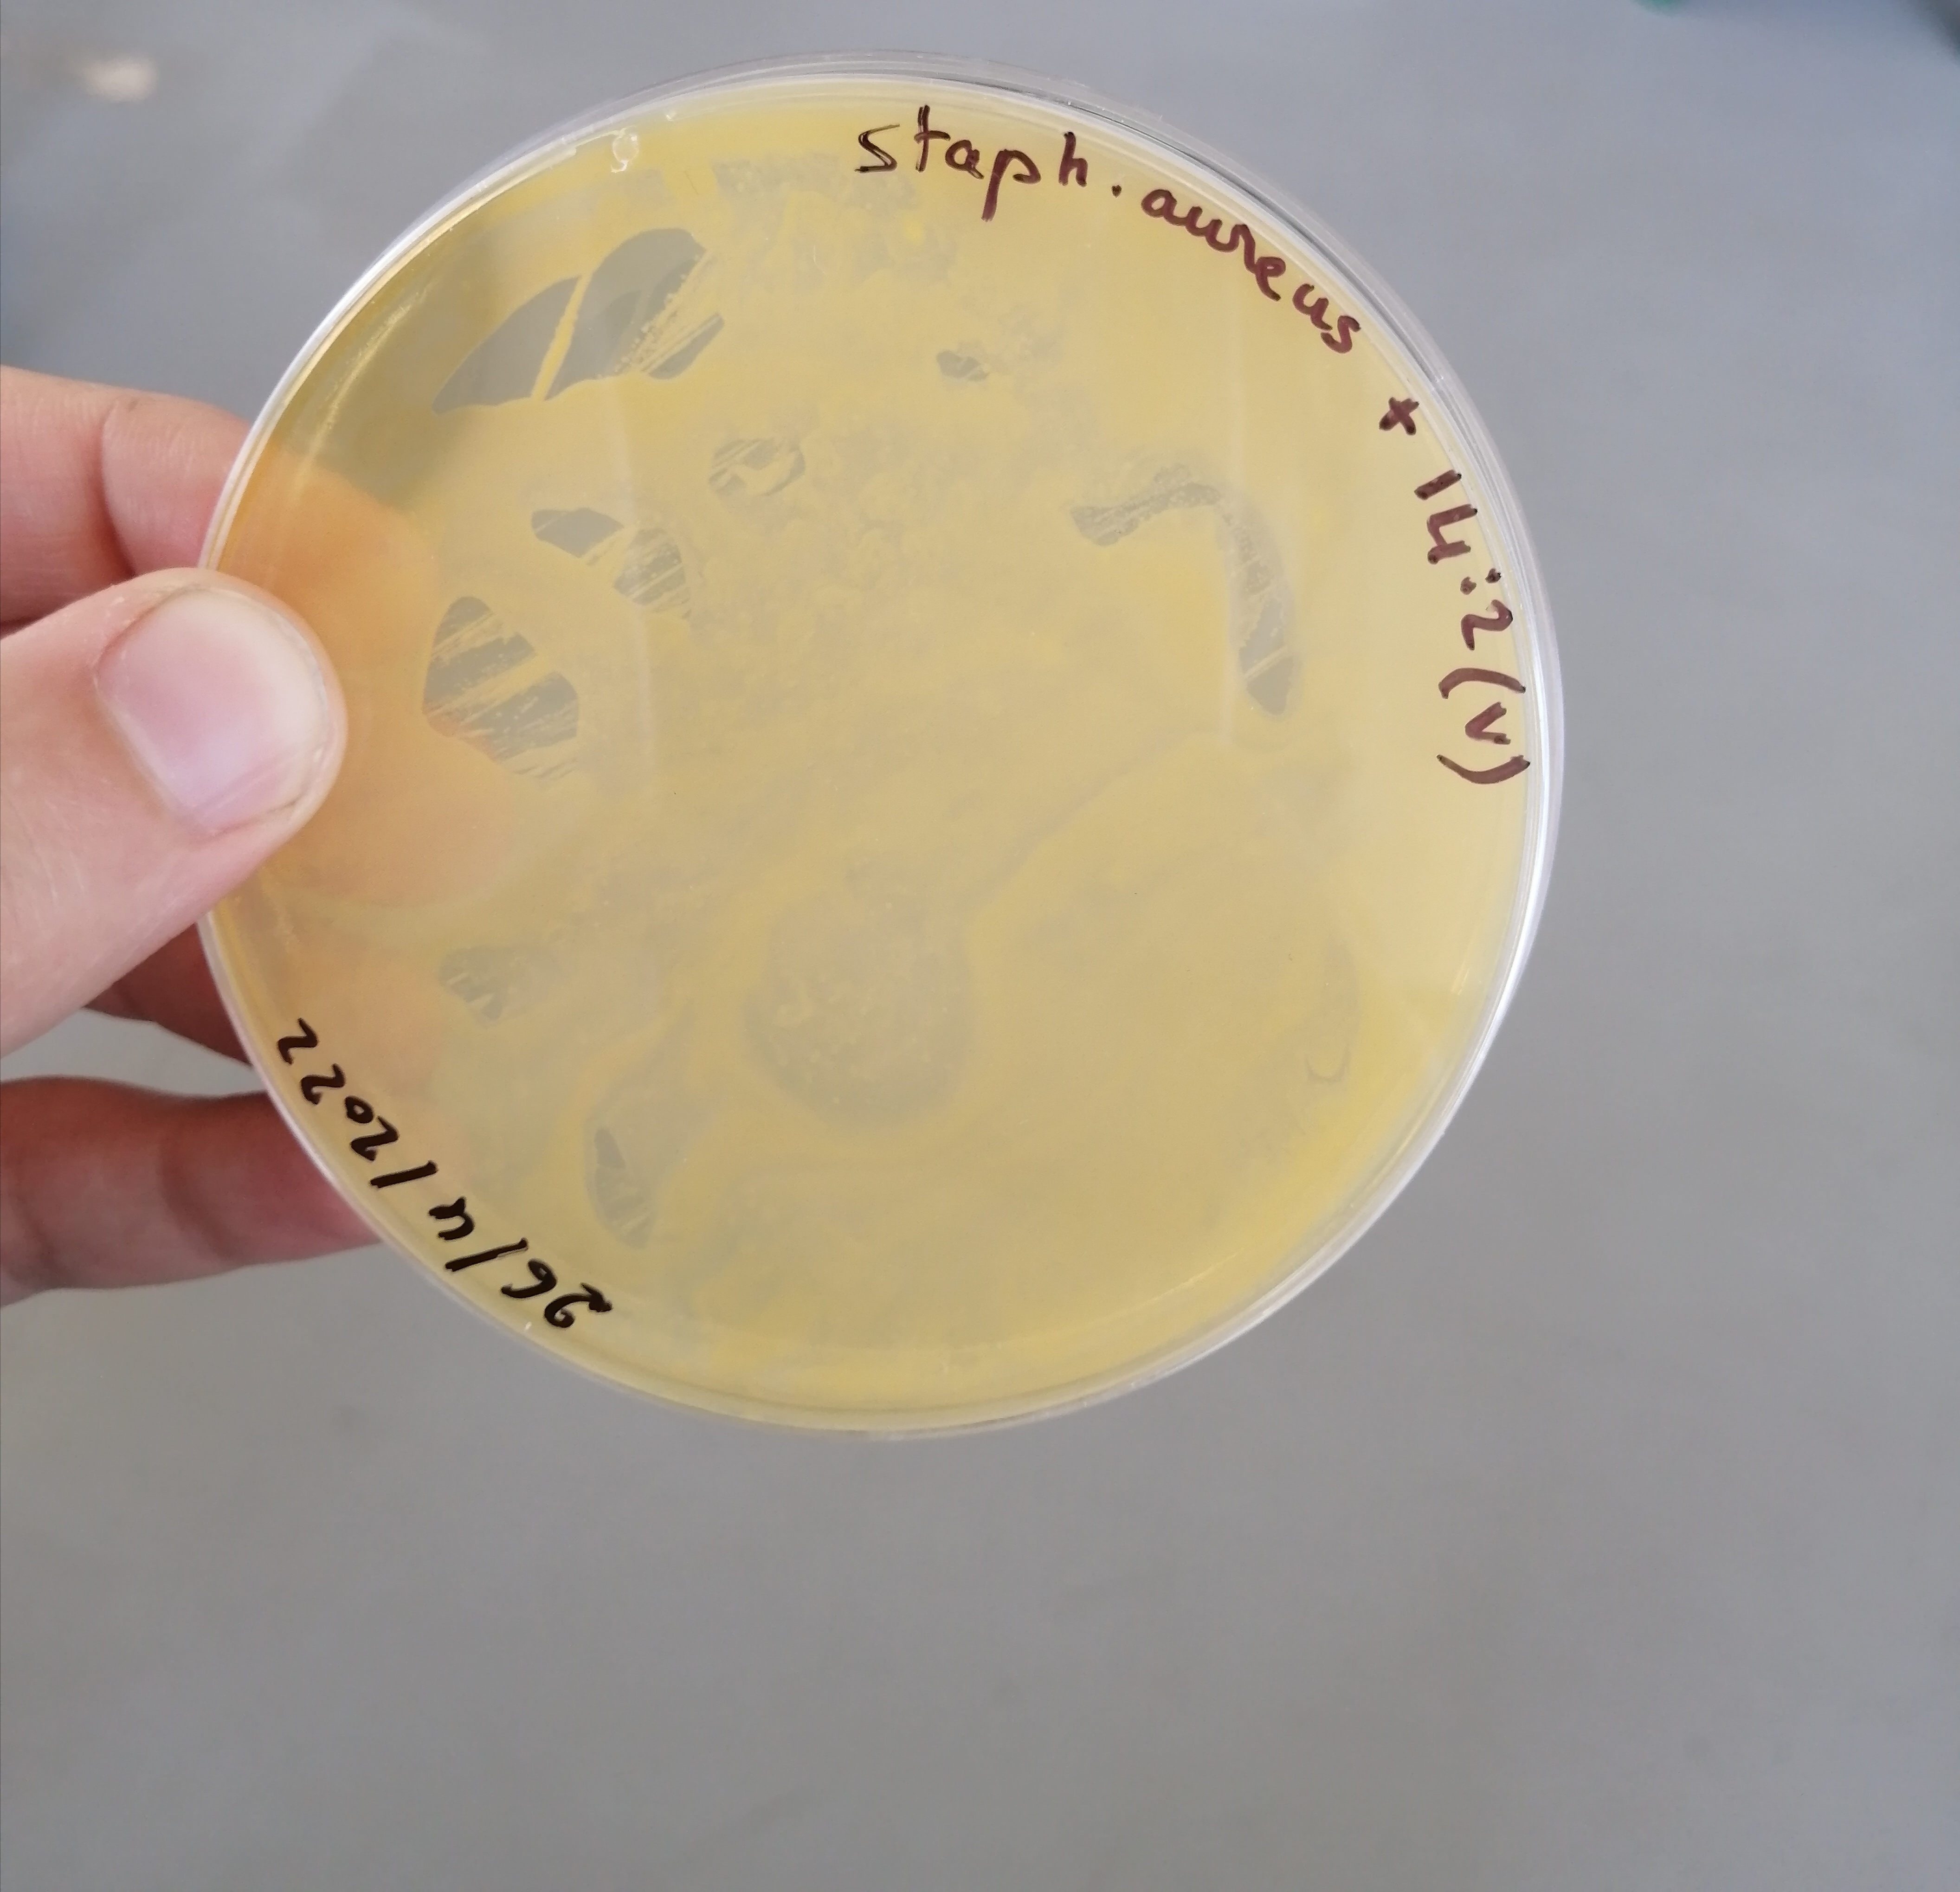
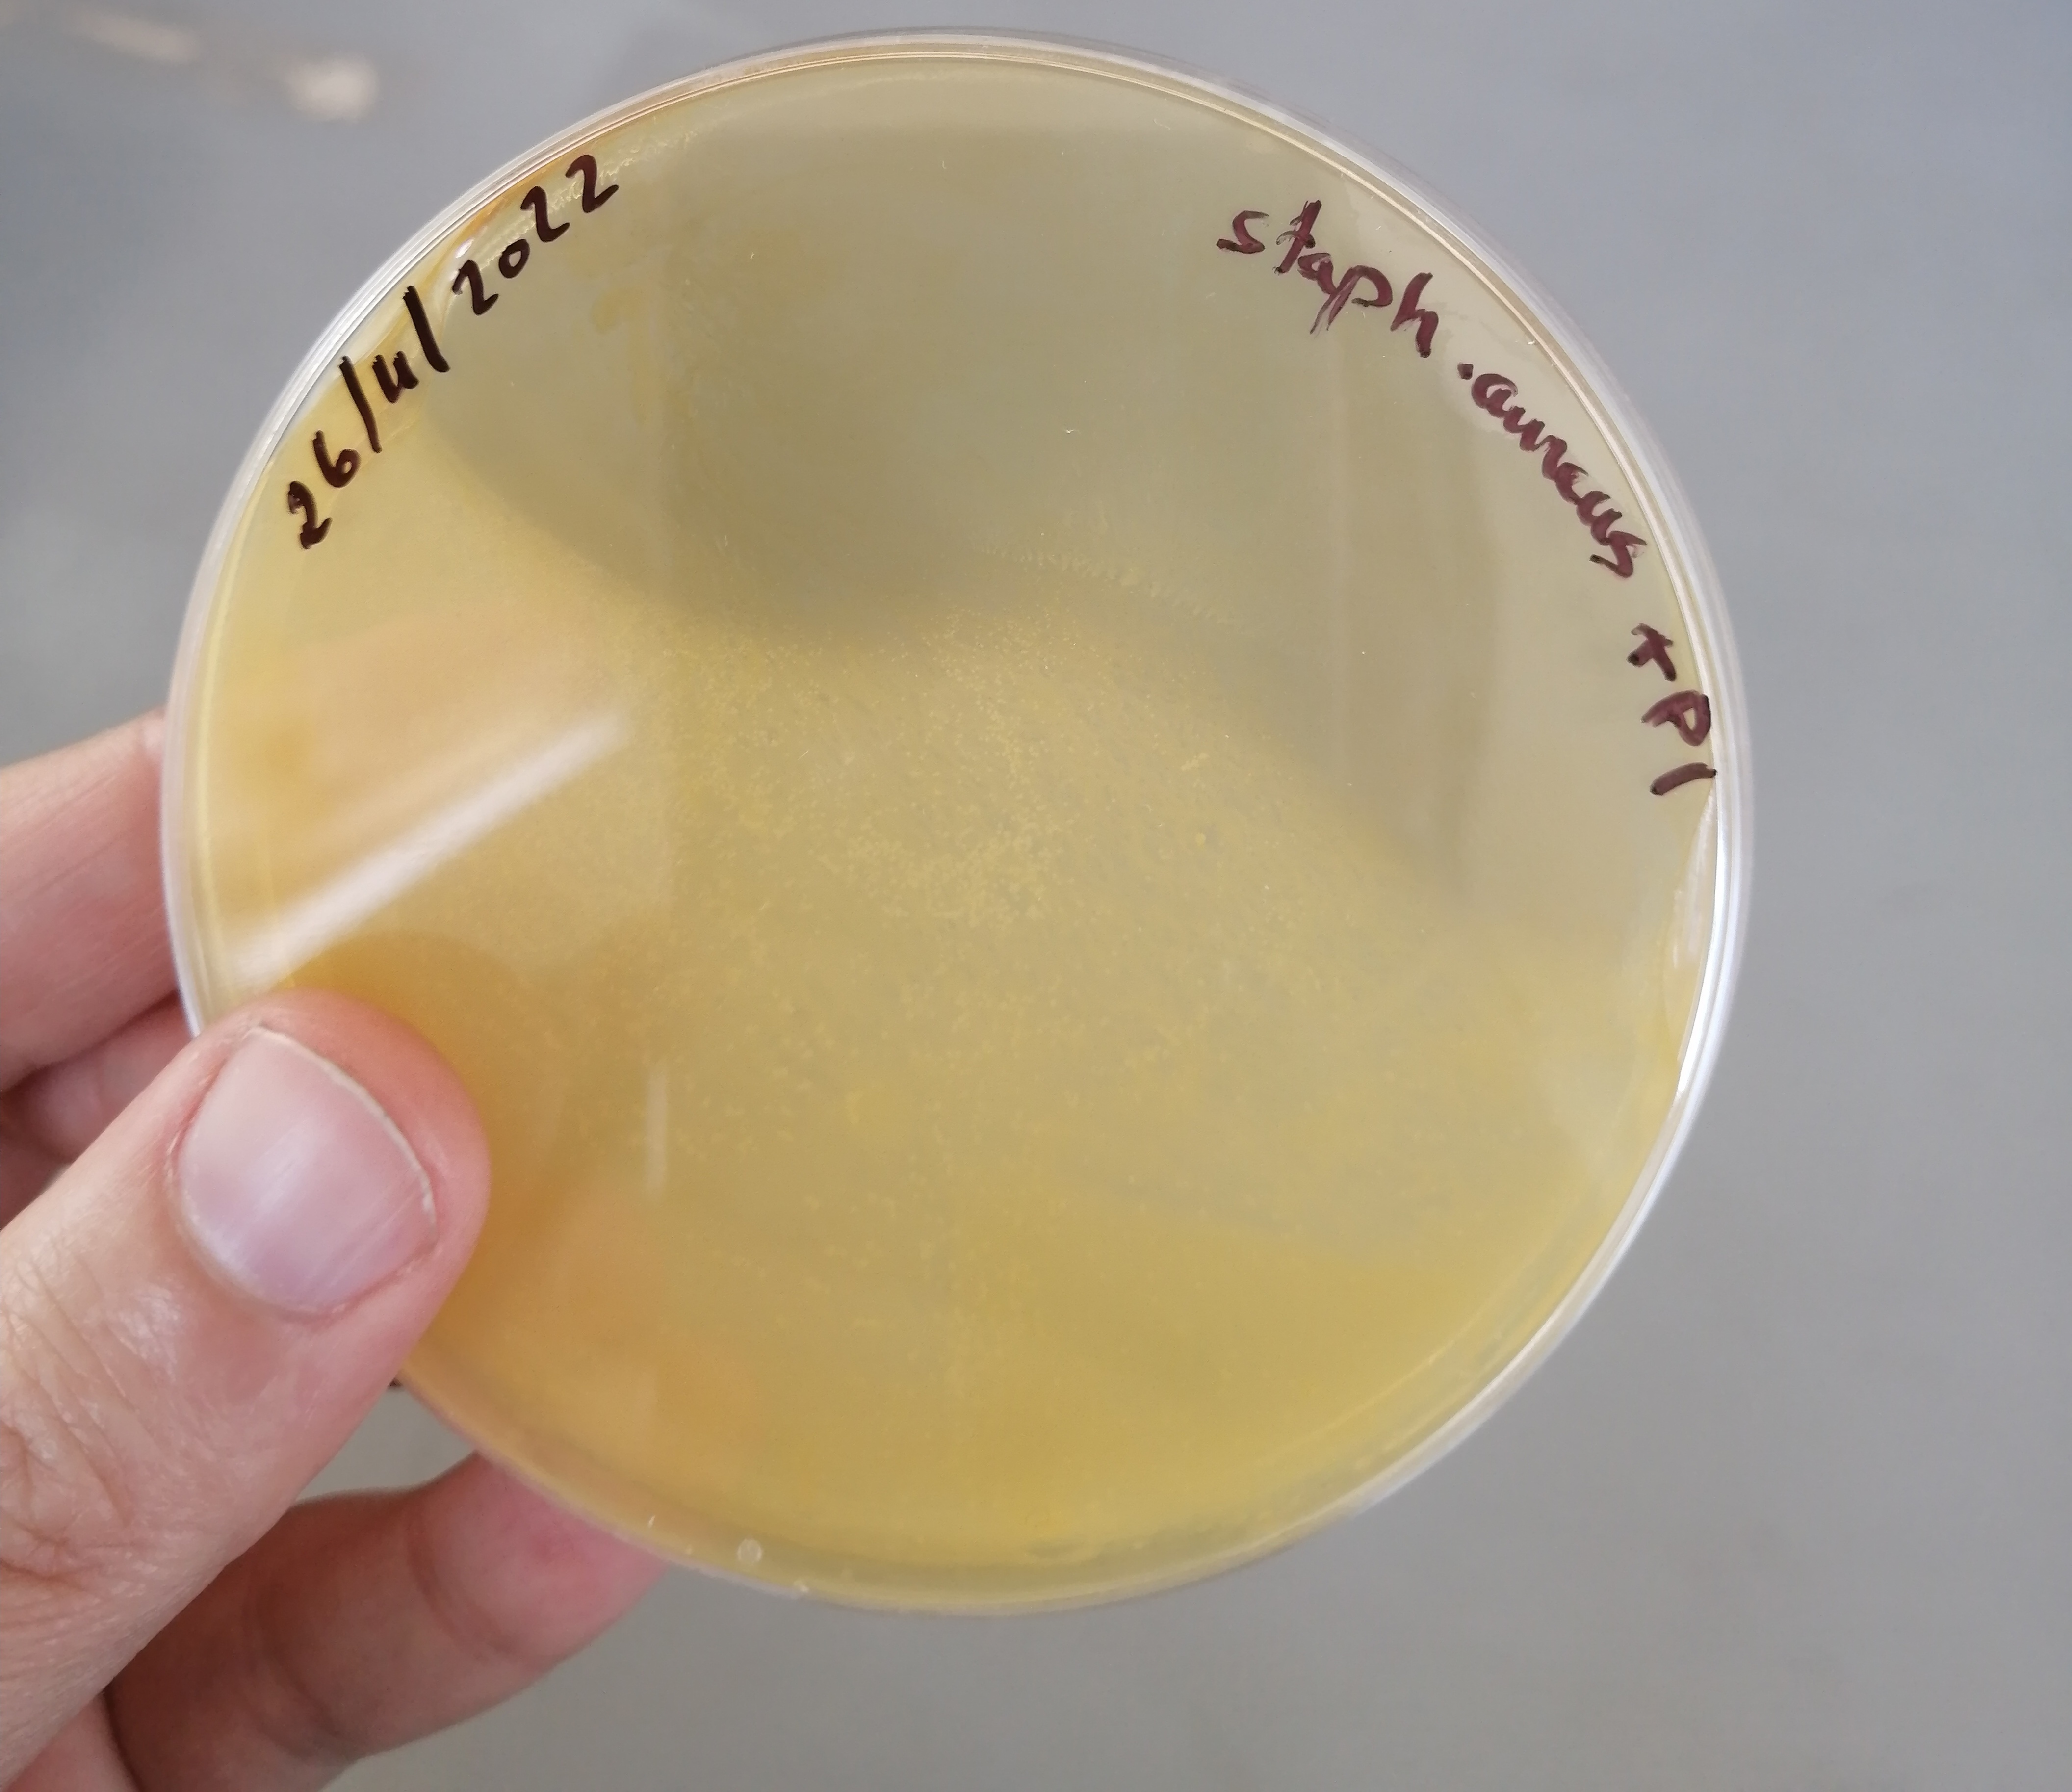
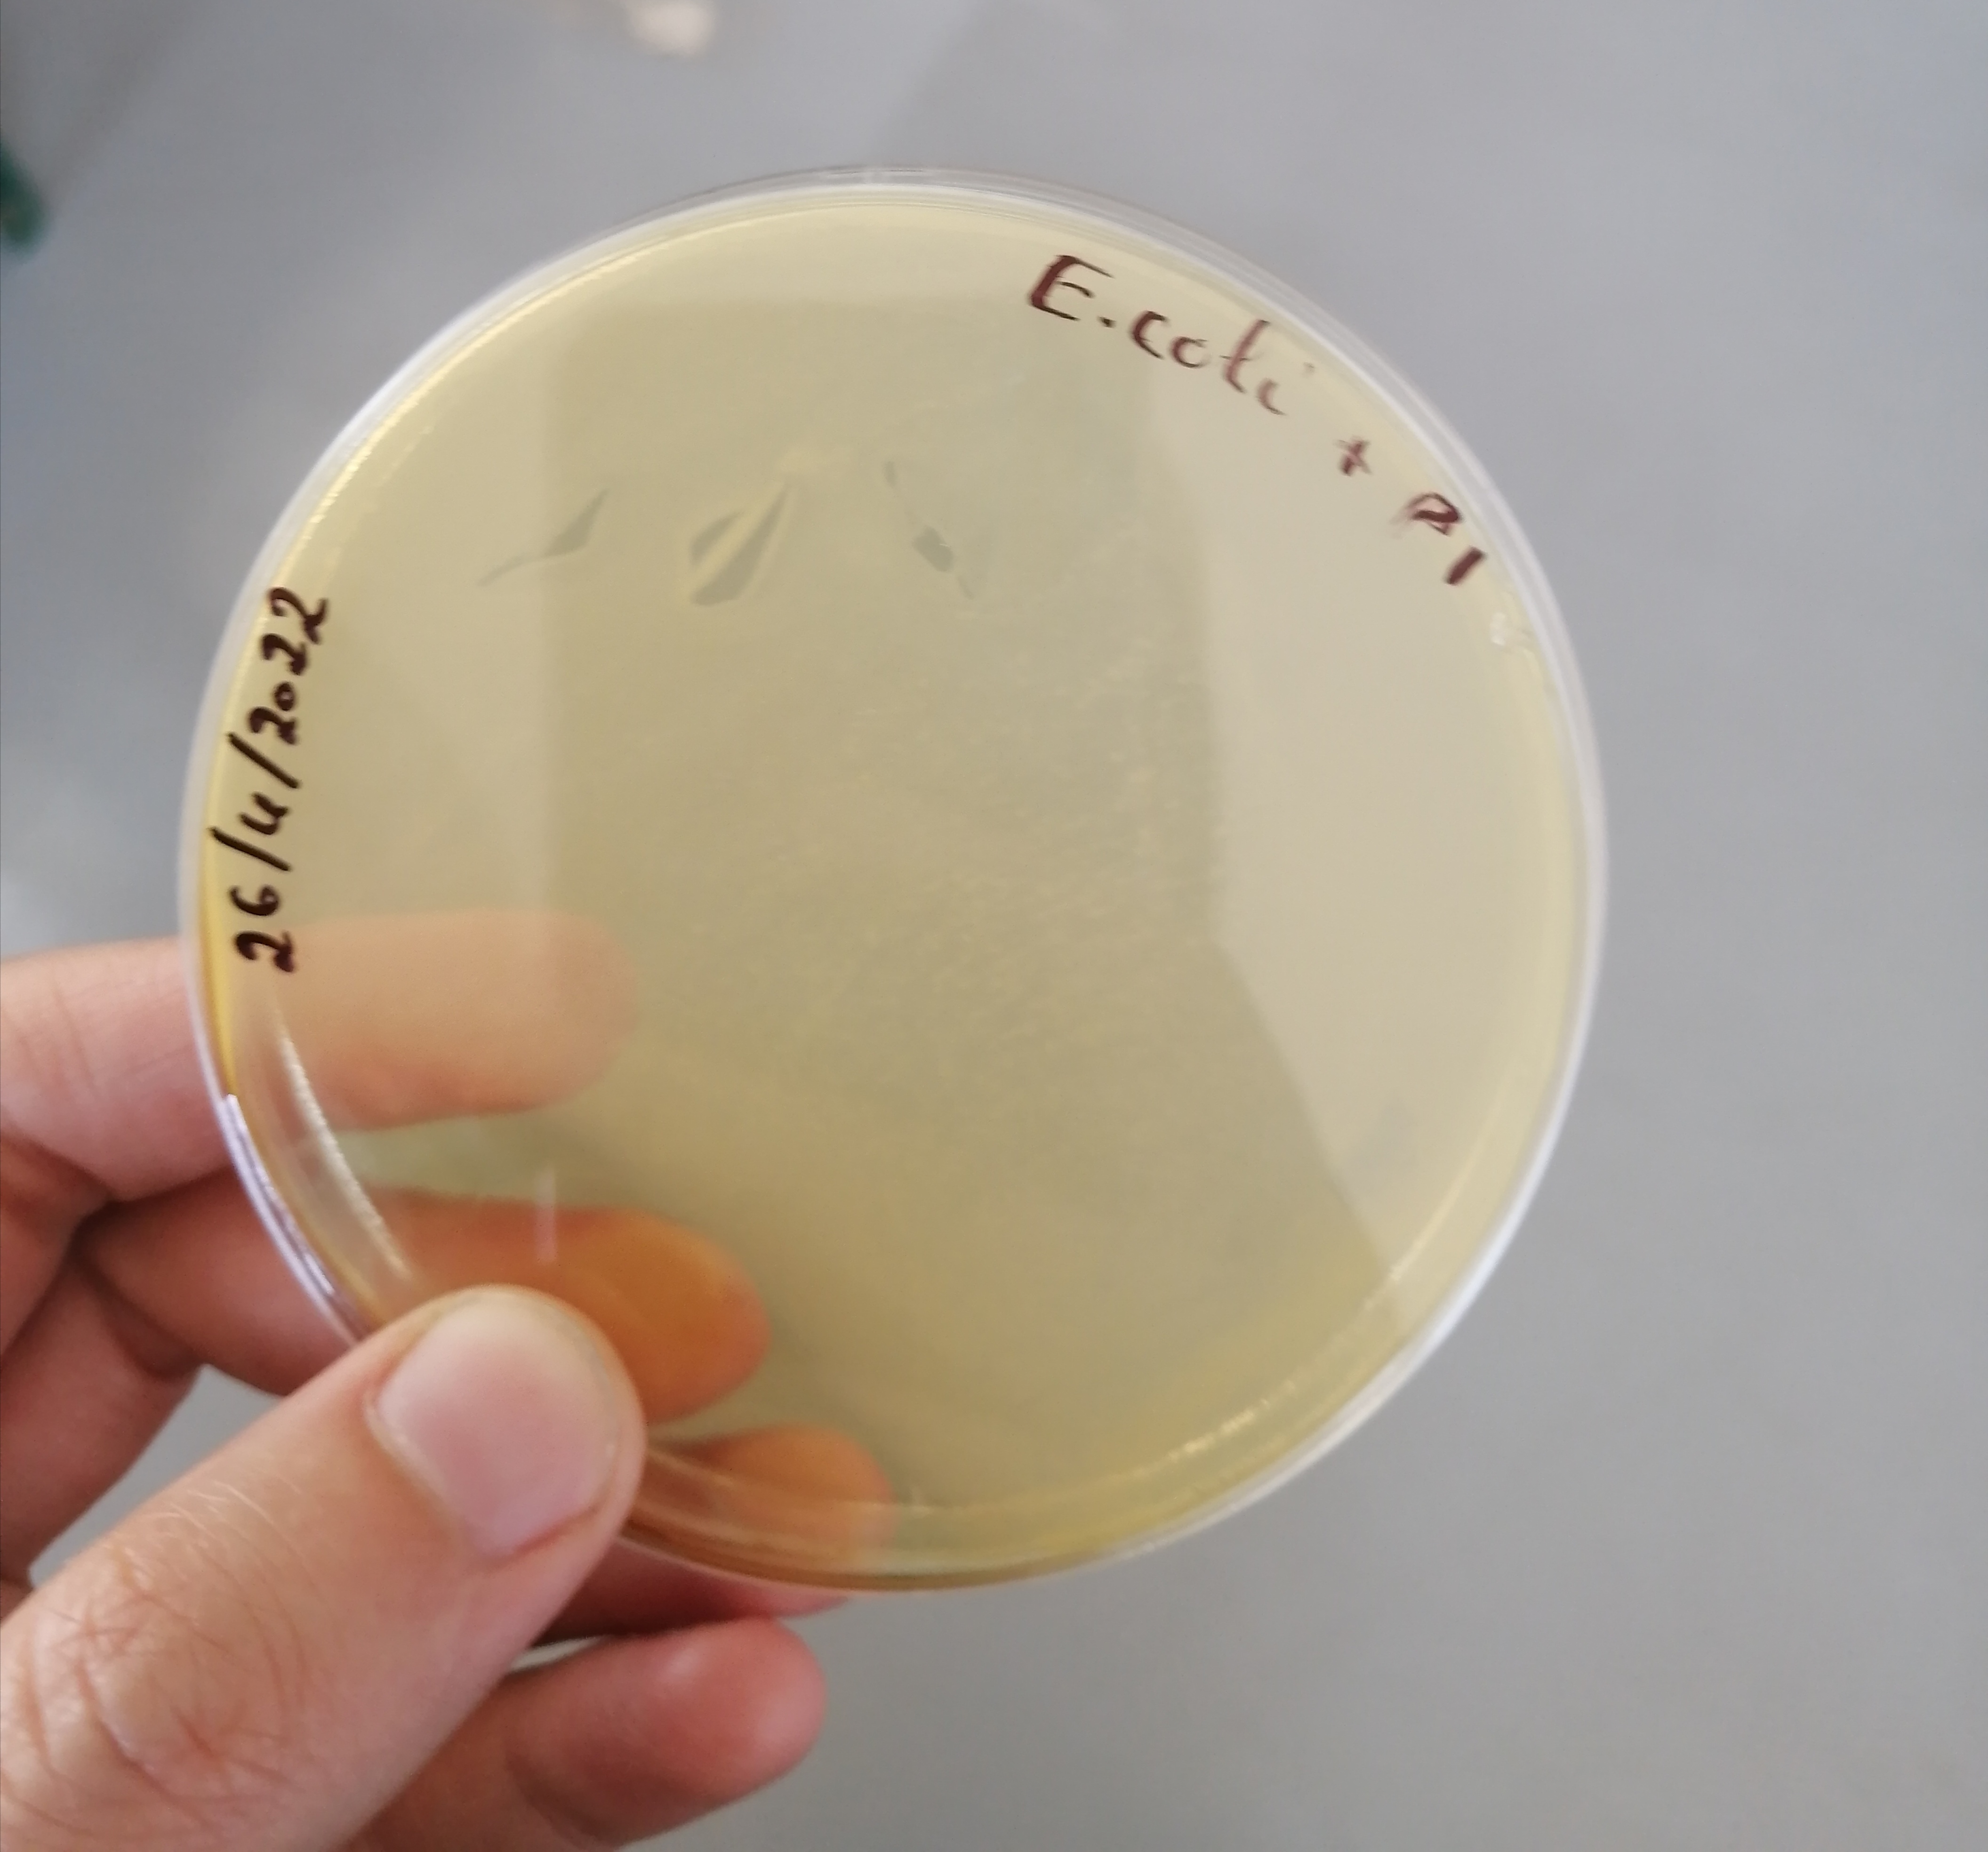
- Here the sterile disk was applied (4 disks per dish) and each of the obtained concentration was added to one of each disk (about 20µl)
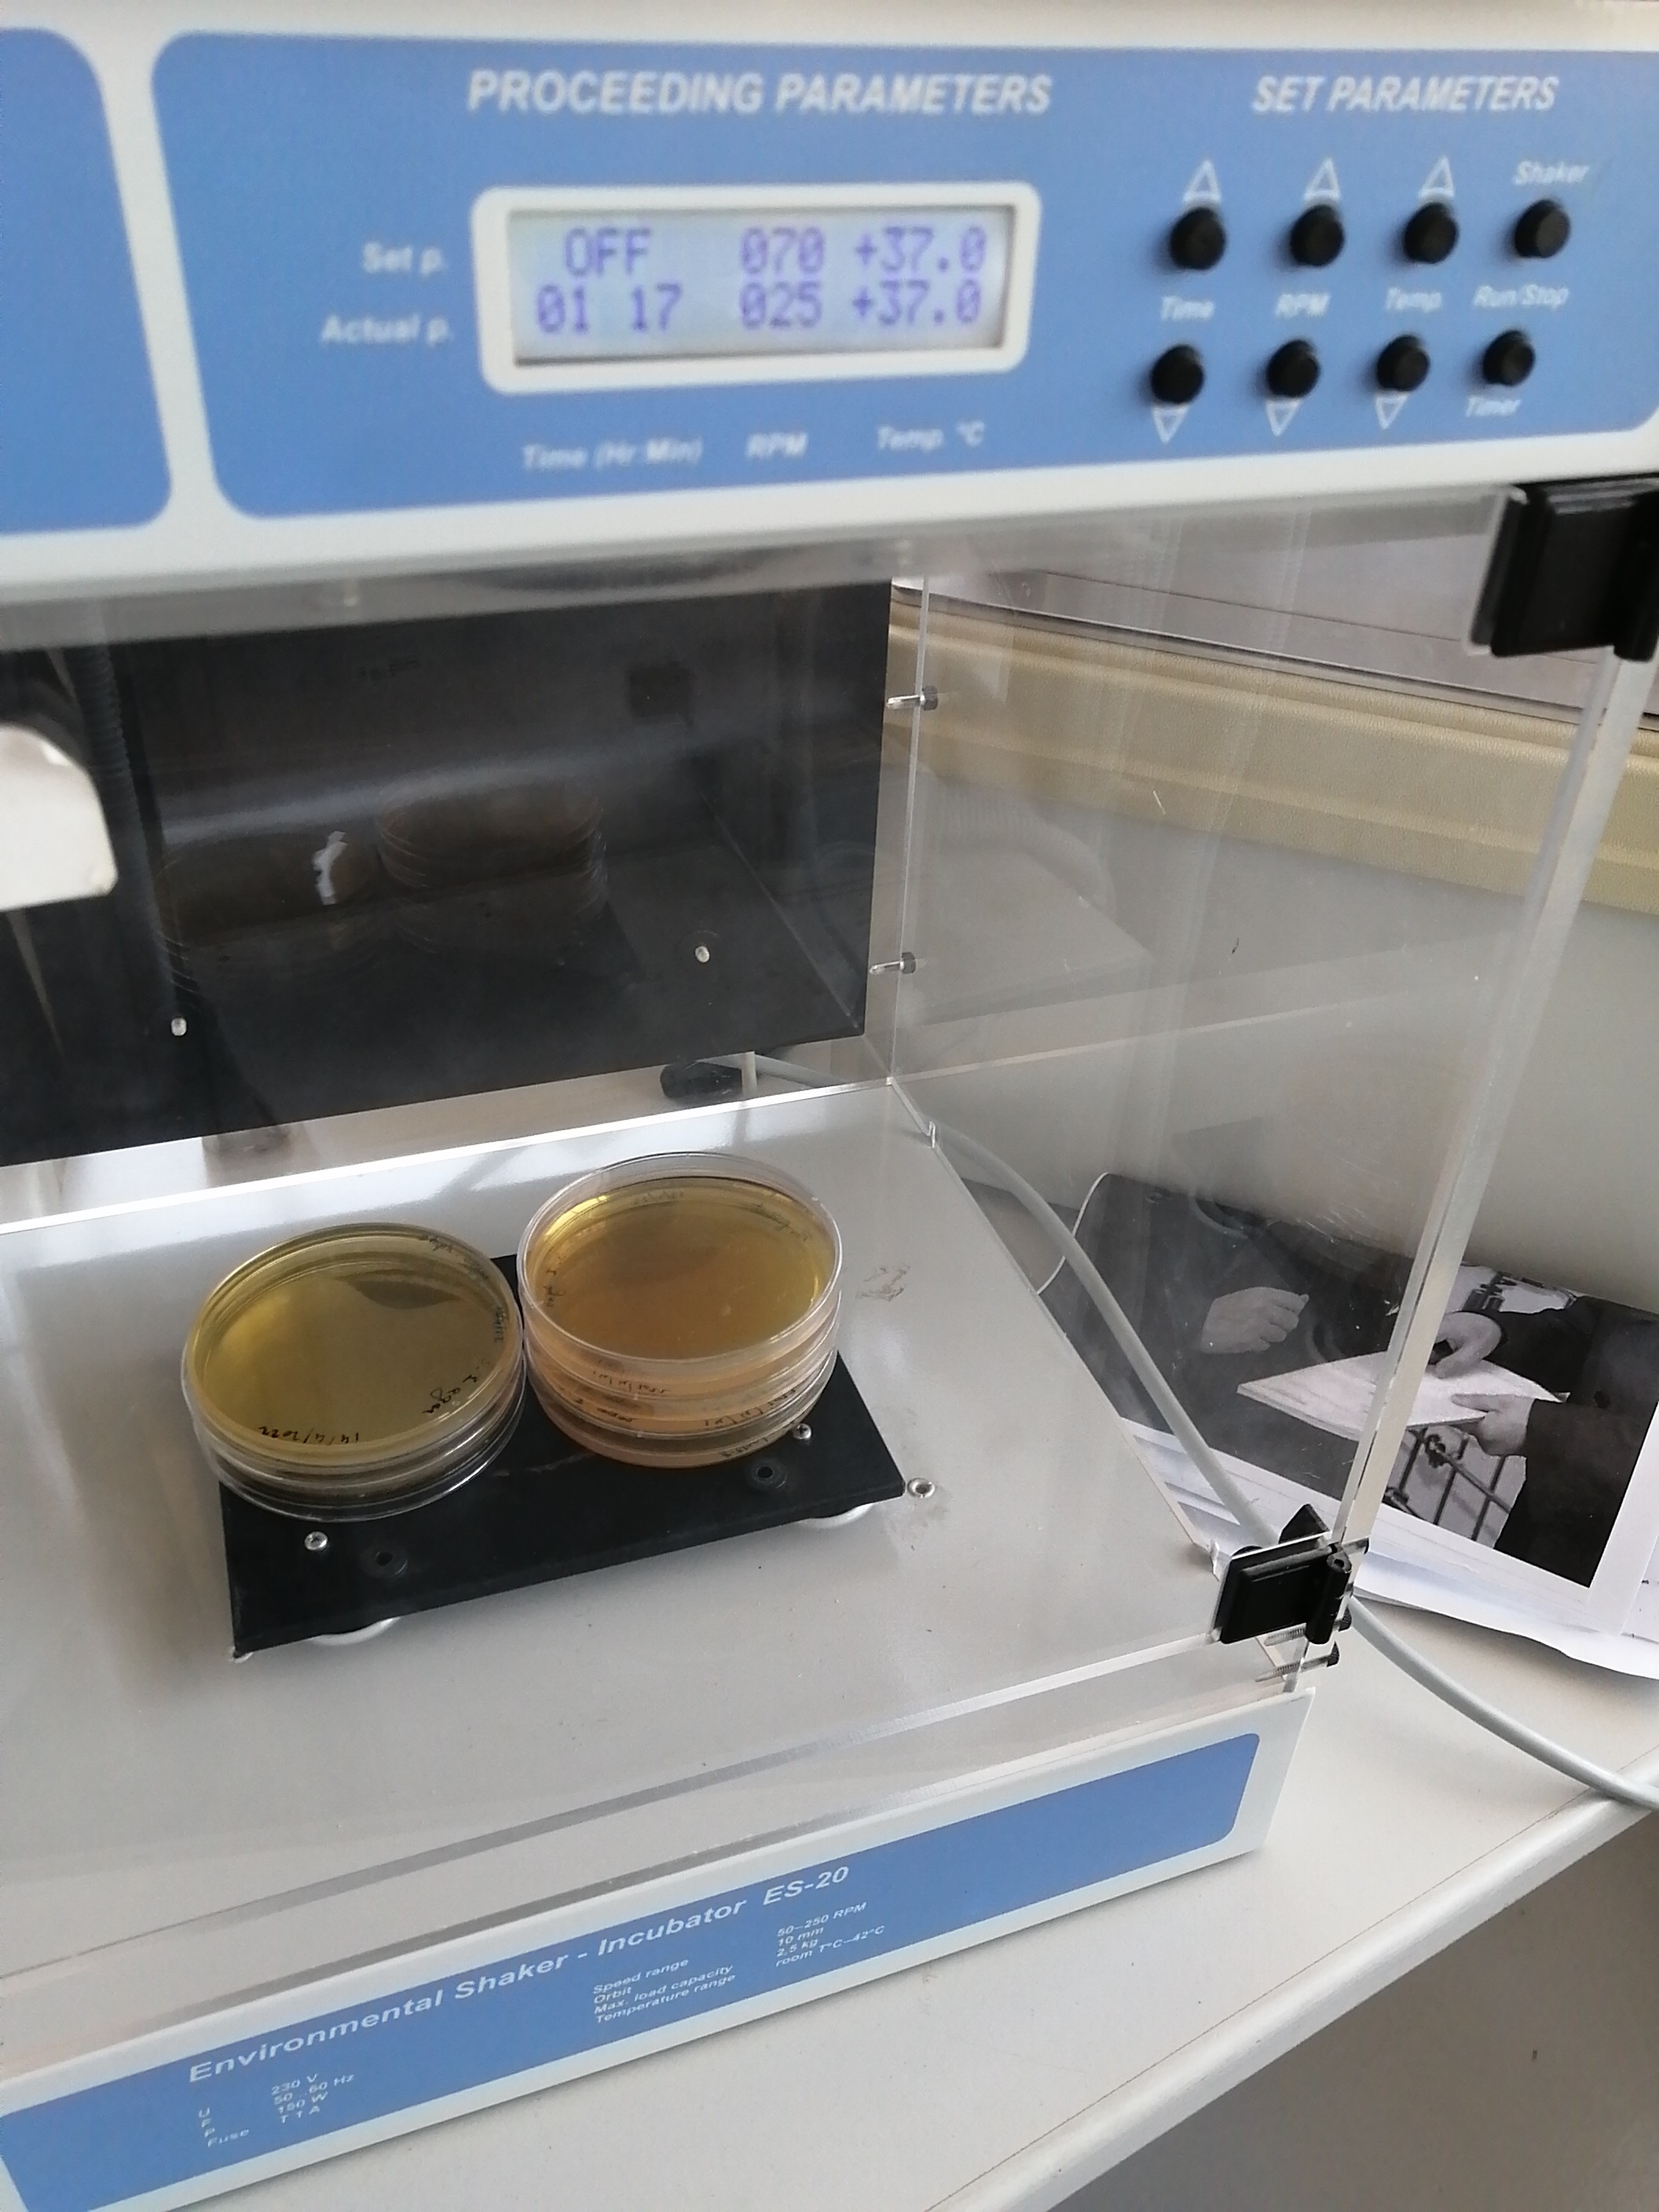
- Finally the plates were incubated at 37oc for 24hours
The second trial of quantification: quantification of our produced penicillin:
The same steps of last quantification protocol are followed and the obtained penicillin is diluted in NaCl0.9%. (we have obtained about 0.1g of penicillin sodium powder ---> diluted in 5 ml NaCl 0.9%).
Results:
![]()
|
Concentration (UI) |
30 |
25 |
20 |
16 |
10 |
? |
|
Log (concentration) |
1.48 |
1.4 |
1.3 |
1.2 |
1 |
? |
|
Diameter (cm) |
2.6 |
2.5 |
2.35 |
2 |
1.9 |
3.5 |
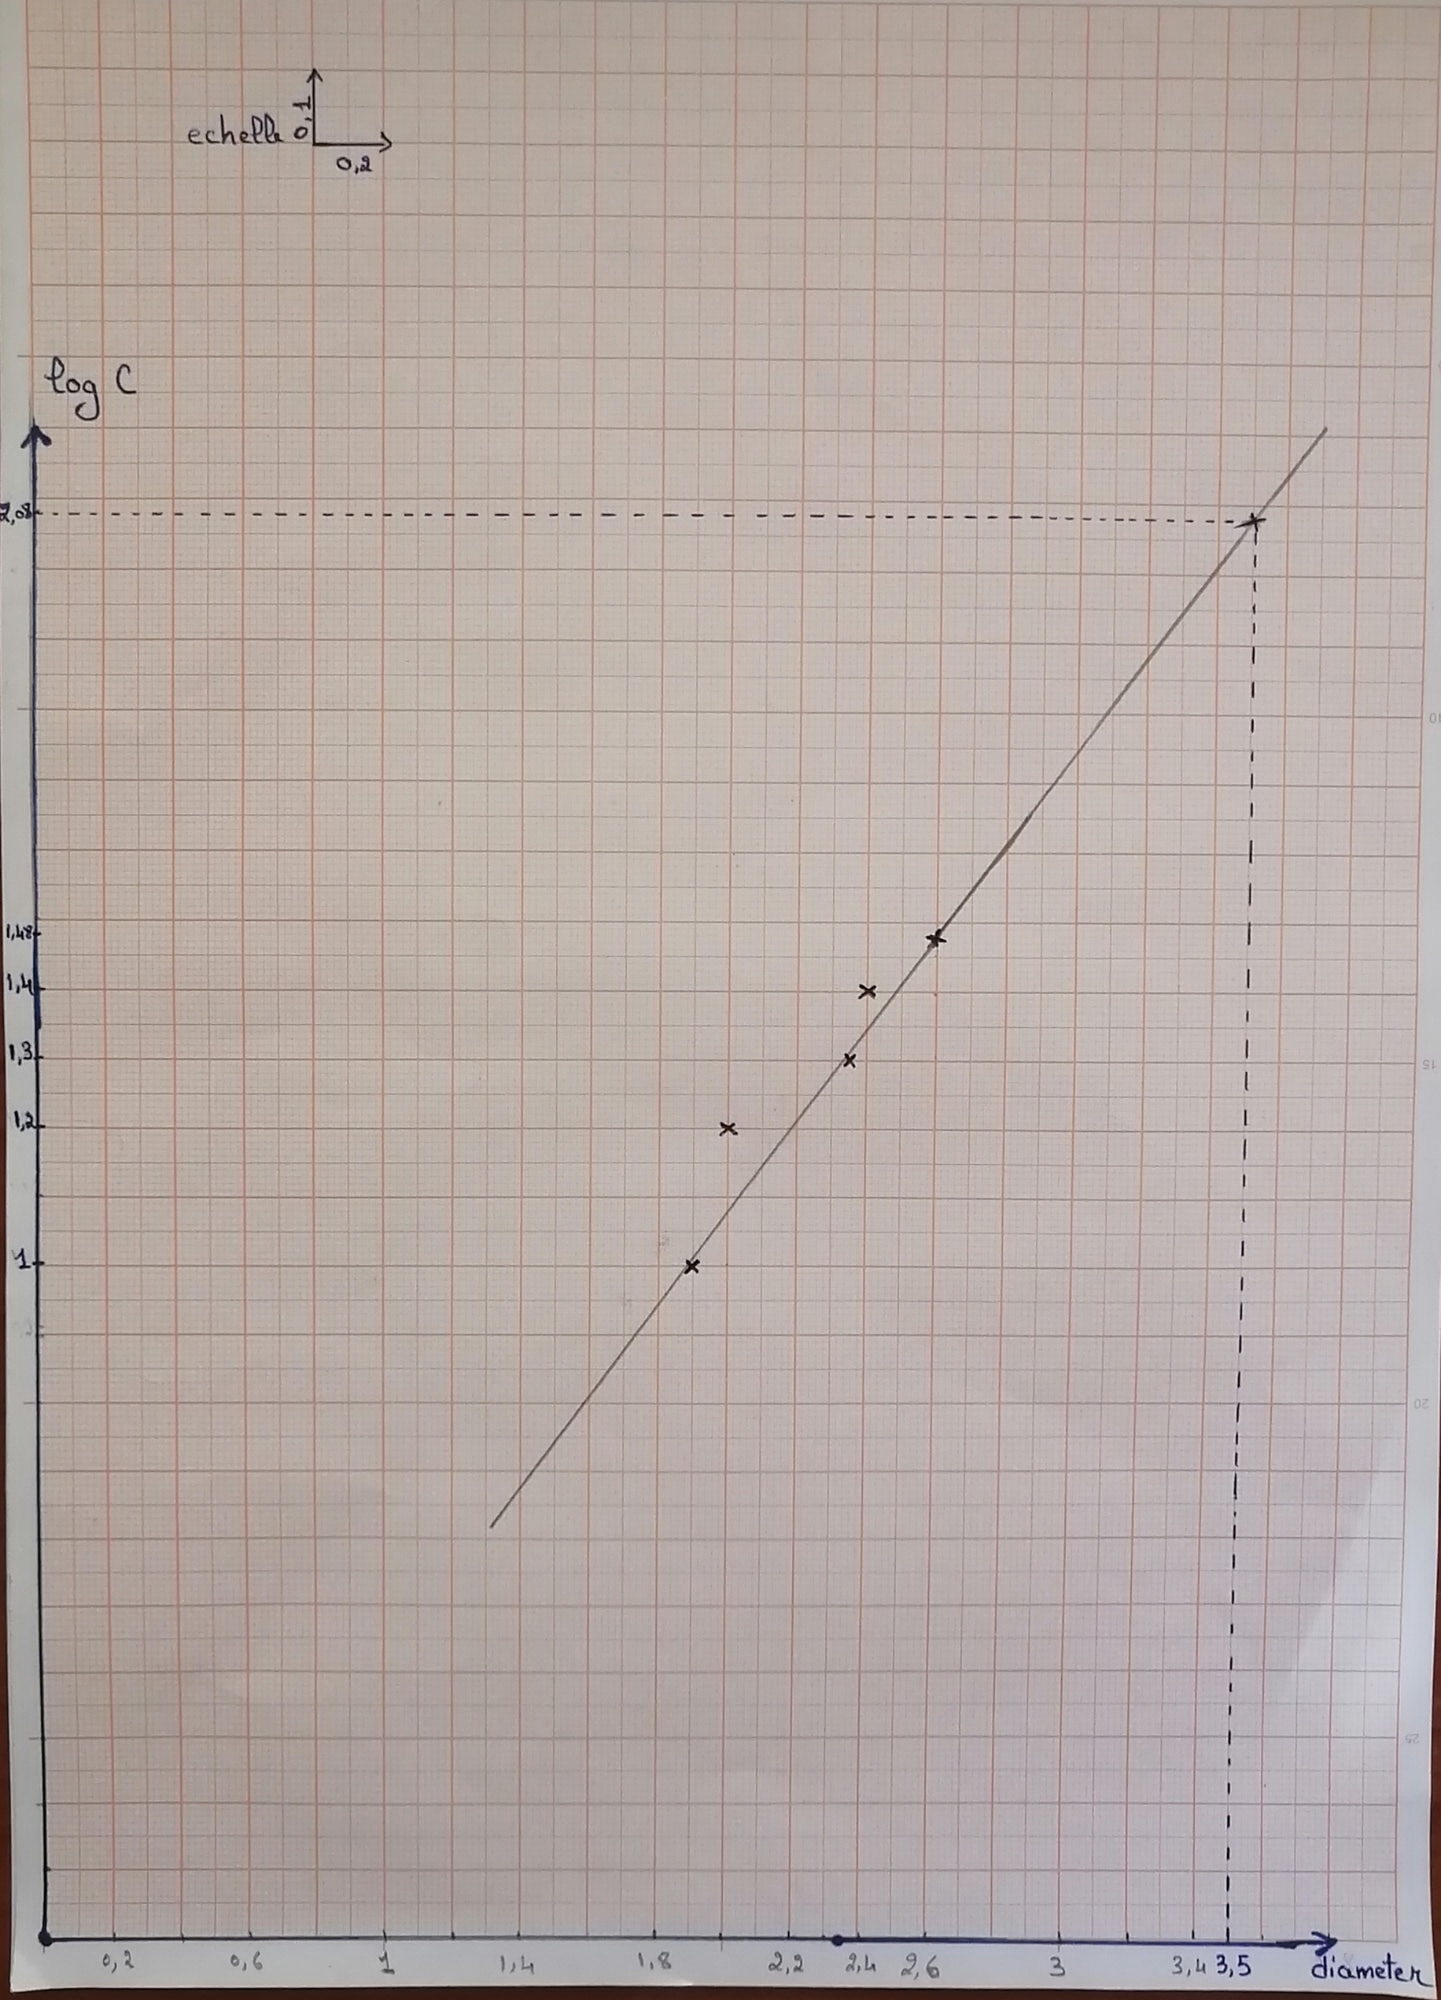
For Diameter= 3.5cm ;log C=2.08 ===> C~120 UI. This result show the effectiveness and the applicability of this methode to quantify the produced penicillin
The second trial of quantification: quantification of our produced penicillin:


لقد أظهرت النتائج وجود
contamination بما معناه كان من الواجب اتخاذ اجراءين احترازيين الأول زيادة وقت التعقيم حتى الساعة باستخدام طنجرة الضغط والثاني وضع
المضاد البكتيري قبل الزراعة على الوسط وليس بعده.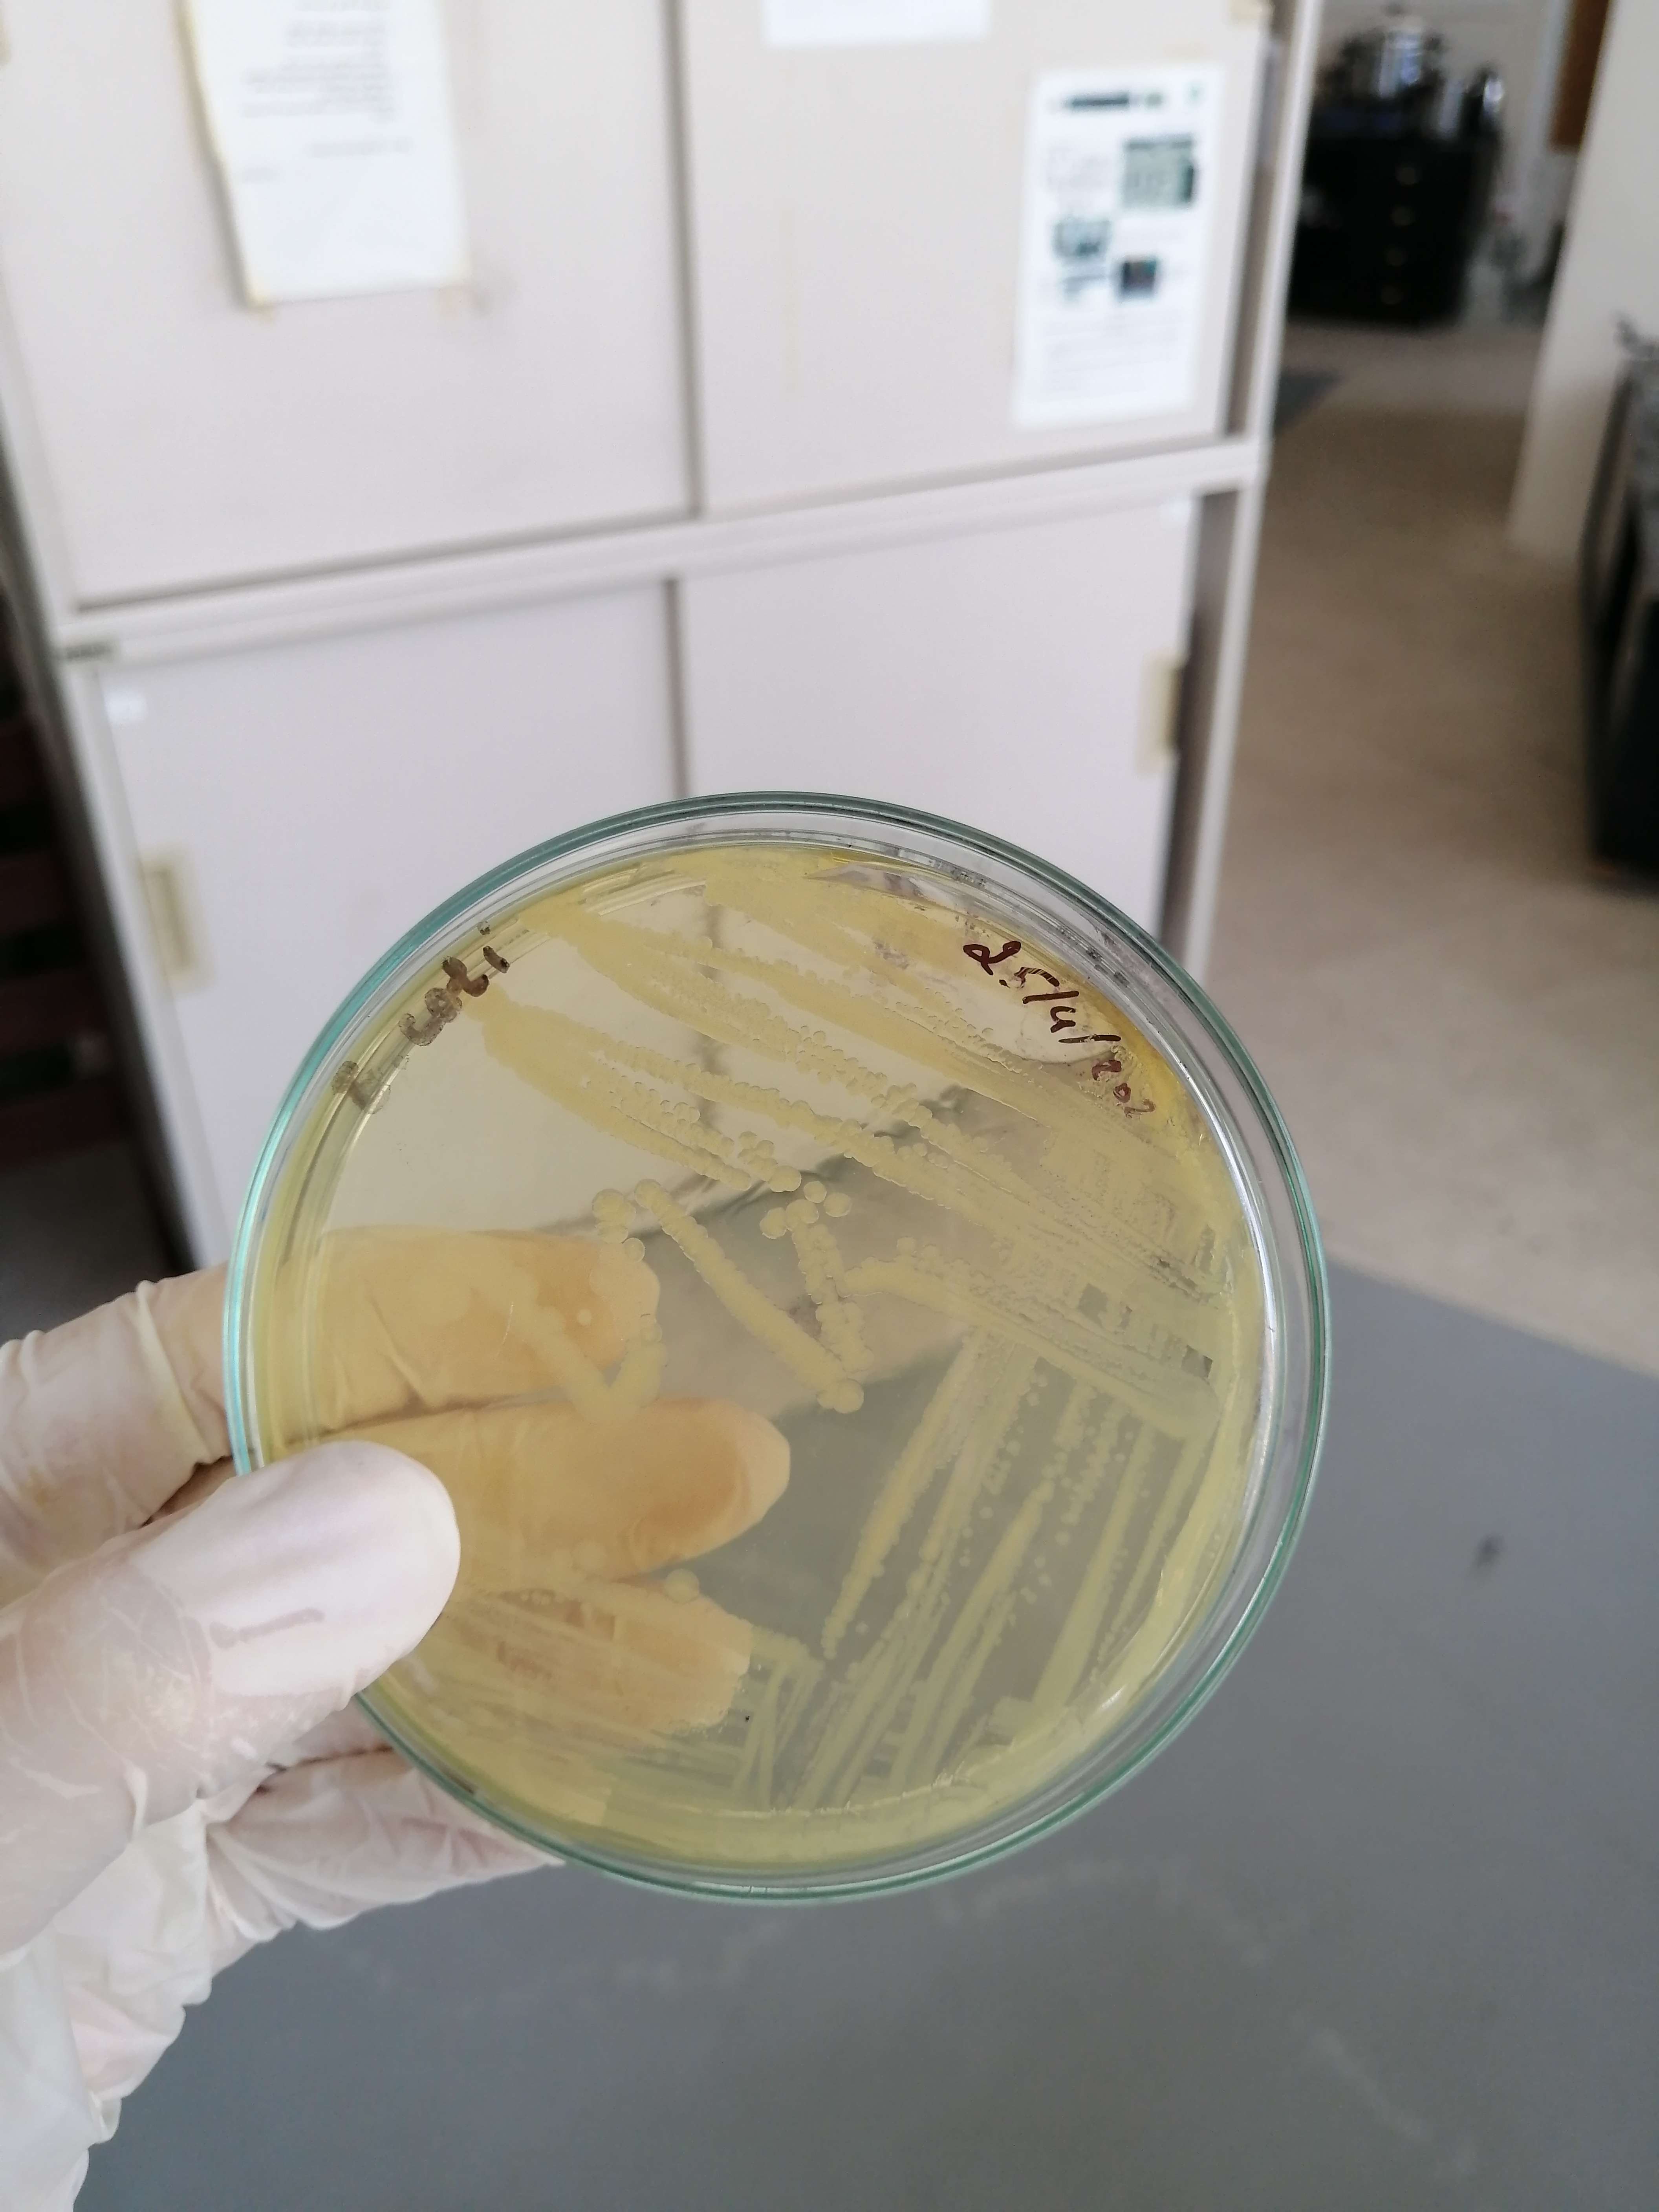
 تم الزرع بهدف الفحص النوعي للبينيسيلين المصنع وبانتظار النتائج غدا ان شاء الله
I- Annex-Penicillin and ampicillin quantification 21-02-2022:
II- Proposed experimental
protocol to quantify the produced penicillin:
Preparation of the turbidity calibration 0.5 McFarland(5):
- we added 0.5 mL of a 0.048 mol/L solution of BaCl2 (1.175% w/v BaCl2 2H2O) to 99.5 mL of a 0.18 mol/L solution (0.36 N) of H2SO4 (1% v/v) and we shook vigorously
- We checked the density of the suspension using a spectrophotometer with a 1 cm beam and matching cuvettes. The absorbance at 625 nm should be between 0.08 and 0.13
- We distributed the suspension in tubes of the same size as those used to adjust the inoculum and then we sealed the tubes
- Once sealed, we stored these tubes at room temperature and protected from light. Before use, we mixed the tube vigorously using a Vortex (6 months’ storage)
The three bacterial strains which can be used:
E.coli / Klebsella.spp / MRSA
Quantification of the produced penicillin using the disk diffusion method (Kirby-Bauer Test)(6):
Preparation of the inoculum:
- We took 3 to 5 colonies of the isolated colonies with a loop, and we added them in 2ml sterile saline (NaCl 0.9%)
- We Vortex the saline tube to create a smooth suspension.
- We adjust the turbidity of this suspension to a 0.5 McFarland standard
by adding more organism if the suspension is too light or diluting with
sterile saline if the suspension is too heavy.
- Use this suspension within 15 minutes of preparation.
- We inoculate the surface of Mueller Hinton agar plate by streaking the swab 3 times over the entire agar surface, we rotated the plate approximately 60֯ each time to ensure an even distribution of the inoculum
6) We allow the plate to sit at room temperature at least 3 to 5 minutes (but no more than 15 minutes) for the surface of the agar plate to dry before proceeding to the next step Preparation of the disks: 7) We dilute the standard penicillin 10 times (Concentrations: 1.5; 1.4; 1.3; 1.2; 1.1; 1.0; 0.9; 0.8; 0.7; 0.6) to obtain different concentrations8) We dip each of the 10 discs in one of the 10 concentrations of penicillin9) We dip another one disk in the unknown produced penicillin10) We distribute the 11 disks in plates at a distance of (26) mm apart11) Once all disks are in place, we replaced the lid, inverted the plate and placed it at 37oC for 18 to 24 hours
Quantification of the produced penicillin:
12) After the growth time, we measured the zone of inhibition that had appeared using a ruler 13) We drew a graph showing the concentration of penicillin as a function of the diameter in order to be able to quantify the produced penicillin (Log C as a function of diameter)
-------------------------------------------------------------
Penicillin Quantification (docx)
Working Plan Dec 2021
|
Monday |
Tuesday |
Wednesday |
Thursday |
Friday |
|
|
|
1 (عرض الطرق الثلاثة واعتماد واحدة) |
2(البحث لوضع مخطط تجريبي موحد) |
3 (تحديد المستلزمات والنواقص) |
|
6 |
7 |
8 |
9 |
10 |
|
13 |
14 |
15 |
16 |
17 |
|
20 |
21 |
22 |
23 |
24 |
|
27 |
28 |
29 |
30 |
31 |
عند تأمين كافة المستلزمات ستتوزع أيام التجربة على الشكل التالي (4-5 أيام):
- يوم لتحضير الوسط الزراعي+ تحضير المياه المالحة+ تحضير الانبوب الشاهد (0.5MF)
- يوم لتحضير أقراص الATB و زراعة البكتيريا الكاشفة
- يوم لتطبيق التجربة من زرع وتطبيق اقراص الATB
- يوم لتقييم النتيجة واستنتاج الكثافة للأمبيسيلين المحضر
ما تحتاجه التجربة:
BaCl2-
Filter paper or penicillin disk with different concentration-
Agar Muller Hinton-
E.coli or S.aureus(SARM)-
Petri dish-
Testing the corrected protcol of penicllin production(7):
In this experience we repeat the same steps but we add this time precursor (acetic anhydride) proportion of 0.5%
and we skipped the purification ( test on filtrate)
Results:
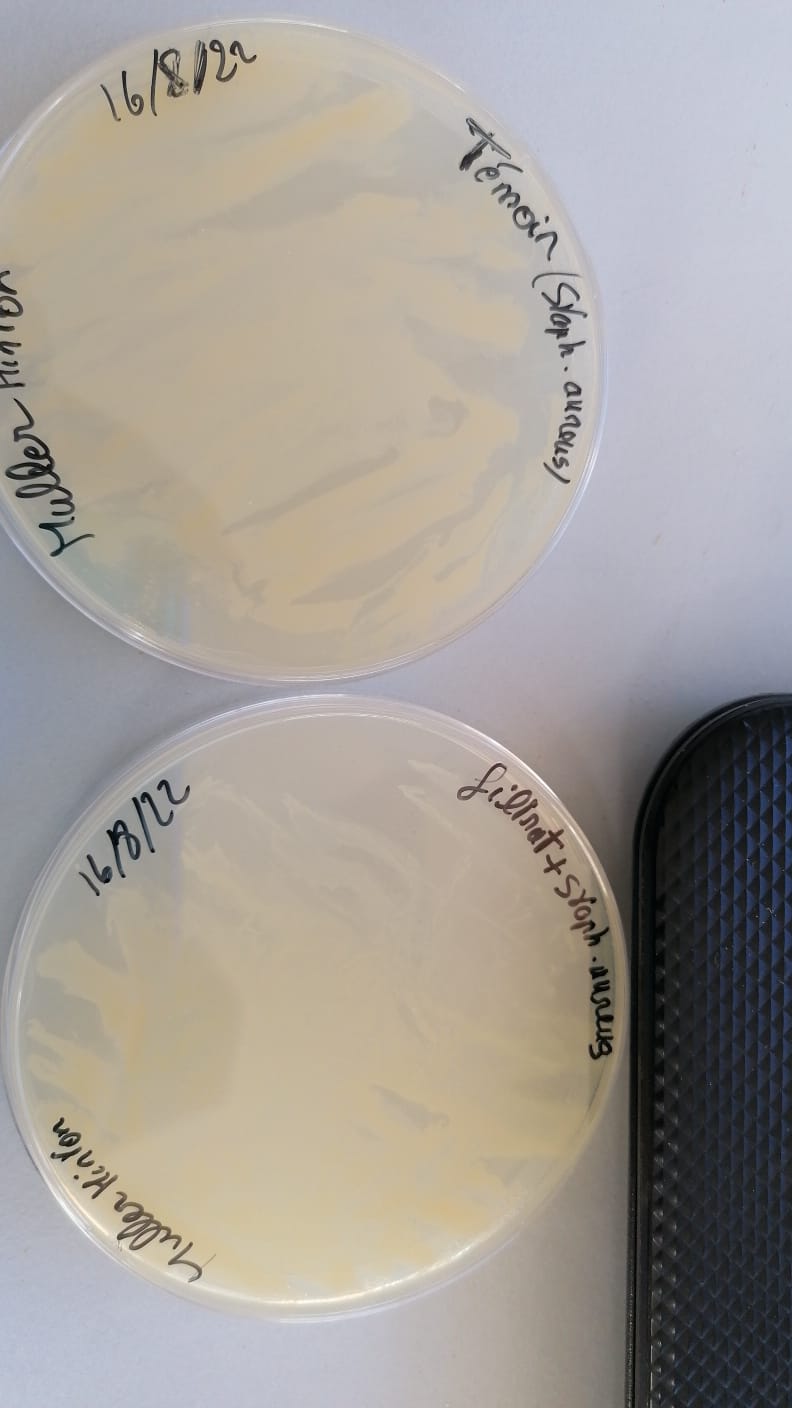
sensibilty test (17/8/22)
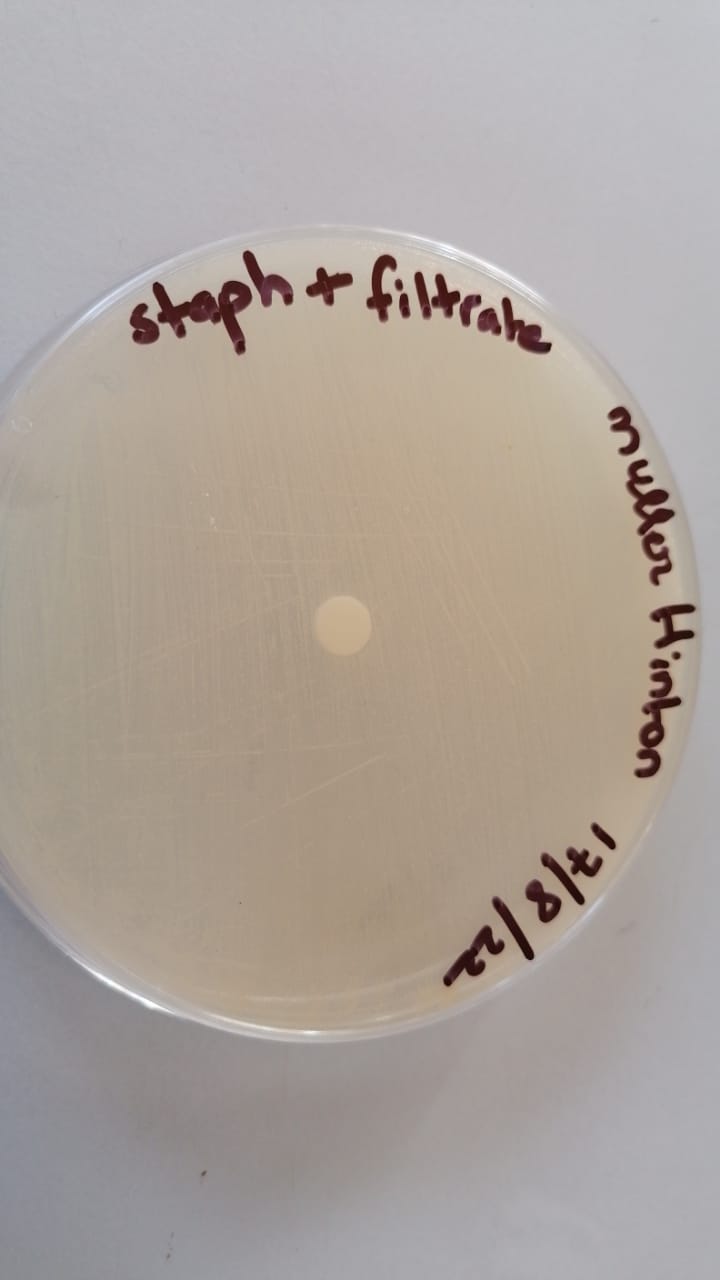
Quantification test using the disk diffusion method (to approve the sensibilty test)

(18/8/22)
Testing the corrected protcol of penicllin production(8):
In this expirence we inoculate the penicillium chrysogenum in LB (liquid broth) and we used new liquid medium to test the diffrence between liquid medium I, II
Results: